pprof
pprof是什么
在golang的package中,有两个包包含pprof:runtime/pprof和net/http/pprof,其中runtime/pprof工具包可以生成pprof可视化工具可以查看的运行时数据,而net/http/pprof则用于分析HTTP服务器的运行时数据,所以其使用具有一定的局限性.
如何通过pprof做系统分析
命令行
在当前目录下查看运行时参数:
go run -cpuprofile cpu.prof -memprofile mem.prof -bench
独立程序添加
import (
	"fmt"
	"time"
	"os"
	"runtime/pprof"
)

func Main() {
	fmt.Println("start pprof...")
	startCPUProfile()
	startMemProfile()
	defer stopCPUProfile()
	for {
		time.Sleep(1 * time.Second)
	}

}

var cpuProfile = "cpu.prof"
var memProfile = "mem.prof"

func startCPUProfile() {
	if cpuProfile != "" {
		f, err := os.Create(cpuProfile)
		if err != nil {
			fmt.Fprintf(os.Stderr, "Can not create cpu profile output file: %s",
				err)
			return
		}
		if err := pprof.StartCPUProfile(f); err != nil {
			fmt.Fprintf(os.Stderr, "Can not start cpu profile: %s", err)
			f.Close()
			return
		}
	}
}
func stopCPUProfile() {
	if cpuProfile != "" {
		pprof.StopCPUProfile() // 把记录的概要信息写到已指定的文件
	}
}

func startMemProfile() {
	if memProfile != "" {
		f, err := os.Create(memProfile)
		if err != nil {
			fmt.Fprintf(os.Stderr, "Can not create mem profile output file: %s", err)
			return
		}
		if err = pprof.WriteHeapProfile(f); err != nil {
			fmt.Fprintf(os.Stderr, "Can not write %s: %s", memProfile, err)
		}
		f.Close()
	}
}
pprof还有很多其他的参数,可以通过help查看使用方式
gin框架中的pprof使用
对于http服务,也可以通过net/http/pprof包中的工具分析系统情况,用于HTTP服务端生成可以被pprof可视化工具可以使用的profile文件,在gin框架中已经集成了相关的接口,可以在gin框架下很方便地使用pprof做系统分析
在使用的时候,需要匿名引入net/http/pprof包,并调用ListenAndServe接口启动监听服务。
import (
	"fmt"
	"net/http"
	"net/http/pprof"

	"github/logs"
	"github/hystrix" //内部包删除,随便写一个
)

var (
	debugMux = http.NewServeMux()
)

// 业务代码注册debug handler
func RegisterDebugHandler(pattern string, handler func(http.ResponseWriter, *http.Request)) {
	debugMux.HandleFunc(pattern, handler)
}

func startDebugServer() {
	if !appConfig.EnablePprof {
		logs.Info("Debug server not enabled.")
		return
	}
	if appConfig.DebugPort == 0 {
		logs.Info("Debug port is not specified.")
		return
	}

	// pprof handler
	debugMux.HandleFunc("/debug/pprof/", pprof.Index)
	debugMux.HandleFunc("/debug/pprof/cmdline", pprof.Cmdline)
	debugMux.HandleFunc("/debug/pprof/profile", pprof.Profile)
	debugMux.HandleFunc("/debug/pprof/symbol", pprof.Symbol)
	debugMux.HandleFunc("/debug/pprof/trace", pprof.Trace)

	// hystrix handler
	hystrixStreamHandler := hystrix.NewStreamHandler()
	hystrixStreamHandler.Start()
	debugMux.Handle("/debug/hystrix.stream", hystrixStreamHandler)

	go func() {
		debugPort := appConfig.DebugPort
		logs.Infof("Start pprof and hystrix listen on: %d", debugPort)
		err := http.ListenAndServe(fmt.Sprintf("0.0.0.0:%d", debugPort), debugMux)
		if err != nil {
			logs.Fatalf("Failed to start debug server: %s", err)
		}
	}()
}
在gin框架中,通过监听一个debug端口,来实现运行时信息的查看,同时通过实现RegisterDebugHandler接口,可以实现自定义服务信息的显示.
func initDebug() {
	ginex.RegisterDebugHandler("/api/v1/", func(responseWriter http.ResponseWriter, request *http.Request) {
		responseWriter.Write([]byte(fmt.Sprint("sth")))
	})
}
其他
- 查看内存信息
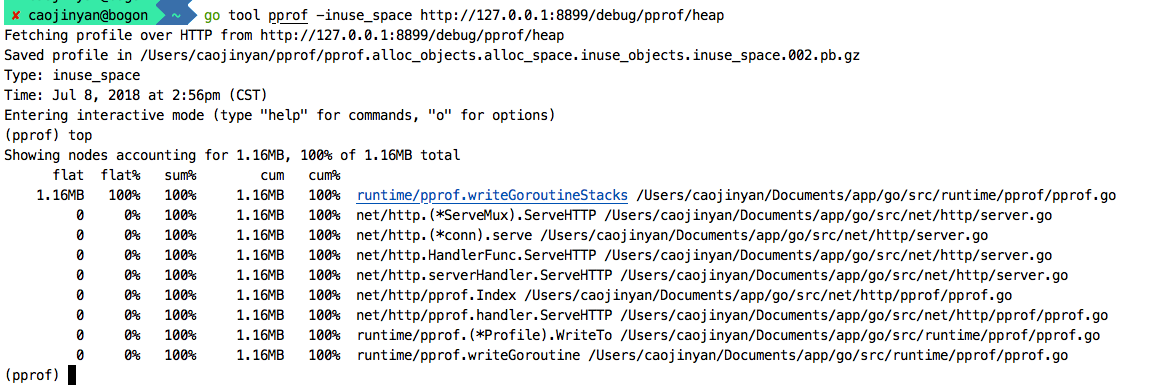
查看堆信息:go tool pprof http://127.0.0.1:8899/debug/pprof/heap
go tool pprof -inuse_space http://127.0.0.1:8899/debug/pprof/heap (查看堆内存的使用信息)
go tool pprof -alloc_space http://127.0.0.1:8899/debug/pprof/heap (查看堆内存的分配信息)
第二行是server服务
(pprof) list ServeHTTP
Total: 1.16MB
通过list命令可以看到在哪个函数占用了多少内存,输出信息中包含了调用堆栈。
- 查看cpu信息
go tool pprof http://127.0.0.1:8899/debug/pprof/profile
- 查看协程阻塞信息
go tool pprof http://127.0.0.1:8899/debug/pprof/block
在查看之前,需要在代码中通过runtime.SetBlockProfileRate配置阻塞时间的采样频率,当rate为1的时候表示对每个事件做采样,小于等于0表示不采样。
收集5s内的调用情况:wget http://127.0.0.1:8899/debug/pprof/trace?seconds=5
- 查看锁信息
go tool pprof http://127.0.0.1:8899/debug/pprof/mutex
使用之前,需要添加runtime.SetMutexProfileFraction调用
导出
- svg格式
在命令后添加-svg选项使得输出以svg的格式显示,导出到文件中
go tool pprof -alloc_space -cum -svg http://127.0.0.1:8899/debug/pprof/heap >alloc.svg
通过浏览器可以打开alloc.svg文件

- gv格式
也可以通过添加--dot生成.gv文件,并通过dot命令转换为图片
go tool pprof --dot  http://127.0.0.1:8899/debug/pprof/block  > block.gv
dot -Tpng block.gv>block.png